There’s nothing I love more than using company time to analyze stats. Today’s subject of analysis is the income distribution in the US.
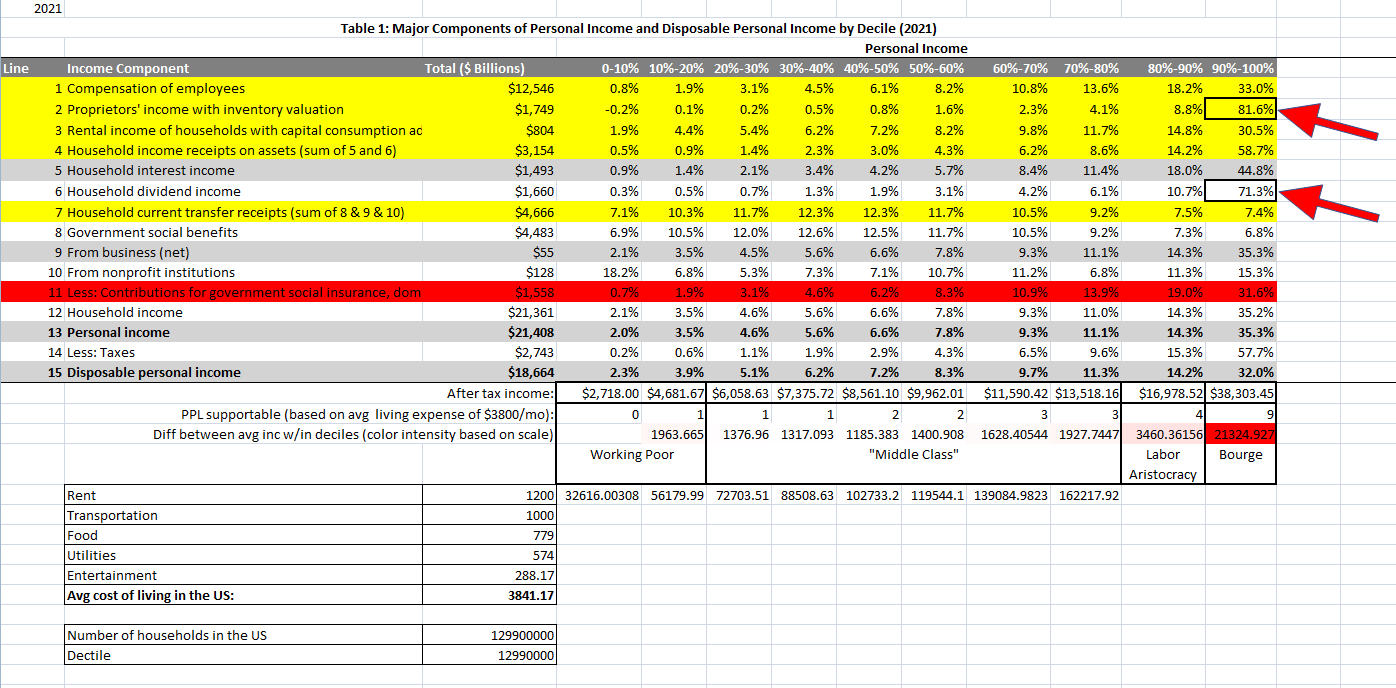
We can tell who the bourge are, from where their income comes from. I’ve highlighted the boxes showing that the top 10% (of households) gets most of their income from business earnings and dividends.
Similarly, we can see the massive difference in monthly income from the 70-80% bracket to the 80-90% bracket to be 3400/mo, and the jump from labour aristocracy to the bourge to be 21000/mo, generated through capital and the exploitation of labour.
Information is from BEA. Search “distribution of personal income”.
The accuracy of these figures are corroborated by Table 2, showing annual mean household income to be $106,000. I have no idea why the popular narrative is that median household income is $76,330.