Source
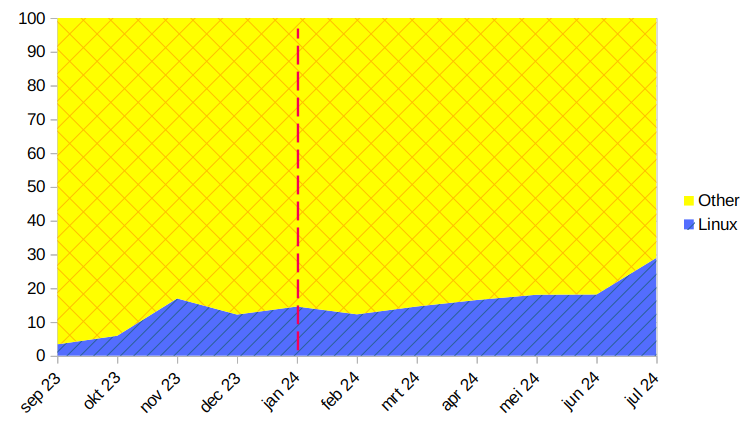
Linux currently 29.1%
Sample size according to StatCounter: 24,353,436 page views
From Wikipedia, the free encyclopedia
Linux is a family of open source Unix-like operating systems based on the Linux kernel, an operating system kernel first released on September 17, 1991 by Linus Torvalds. Linux is typically packaged in a Linux distribution (or distro for short).
Distributions include the Linux kernel and supporting system software and libraries, many of which are provided by the GNU Project. Many Linux distributions use the word "Linux" in their name, but the Free Software Foundation uses the name GNU/Linux to emphasize the importance of GNU software, causing some controversy.
Community icon by Alpár-Etele Méder, licensed under CC BY 3.0
Source
Linux currently 29.1%
Sample size according to StatCounter: 24,353,436 page views
I downloaded the data from globalstats statscounter
How do you make the graph? What type of graph is it?
So I can use it for browser marketshare and search engine marketshare.
You can download the .csv data from the website. Then make a stacked area chart in something like Excel/Google Sheets/Libreoffice Calc.