this post was submitted on 10 Sep 2024
457 points (97.1% liked)
Data is Beautiful
4519 readers
26 users here now
A place to share and discuss visual representations of data: Graphs, charts, maps, etc.
DataIsBeautiful is for visualizations that effectively convey information. Aesthetics are an important part of information visualization, but pretty pictures are not the sole aim of this subreddit.
A place to share and discuss visual representations of data: Graphs, charts, maps, etc.
  A post must be (or contain) a qualifying data visualization.

  Directly link to the original source article of the visualization
    Original source article doesn't mean the original source image. Link to the full page of the source article as a link-type submission.
    If you made the visualization yourself, tag it as [OC]

  [OC] posts must state the data source(s) and tool(s) used in the first top-level comment on their submission.

  DO NOT claim "[OC]" for diagrams that are not yours.

  All diagrams must have at least one computer generated element.

  No reposts of popular posts within 1 month.

  Post titles must describe the data plainly without using sensationalized headlines. Clickbait posts will be removed.

  Posts involving American Politics, or contentious topics in American media, are permissible only on Thursdays (ET).

  Posts involving Personal Data are permissible only on Mondays (ET).
Please read through our FAQ if you are new to posting on DataIsBeautiful. Commenting Rules
Don't be intentionally rude, ever.

Comments should be constructive and related to the visual presented. Special attention is given to root-level comments.

Short comments and low effort replies are automatically removed.

Hate Speech and dogwhistling are not tolerated and will result in an immediate ban.

Personal attacks and rabble-rousing will be removed.

Moderators reserve discretion when issuing bans for inappropriate comments. Bans are also subject to you forfeiting all of your comments in this community.
Originally r/DataisBeautiful
founded 1 year ago
MODERATORS
you are viewing a single comment's thread
view the rest of the comments
view the rest of the comments
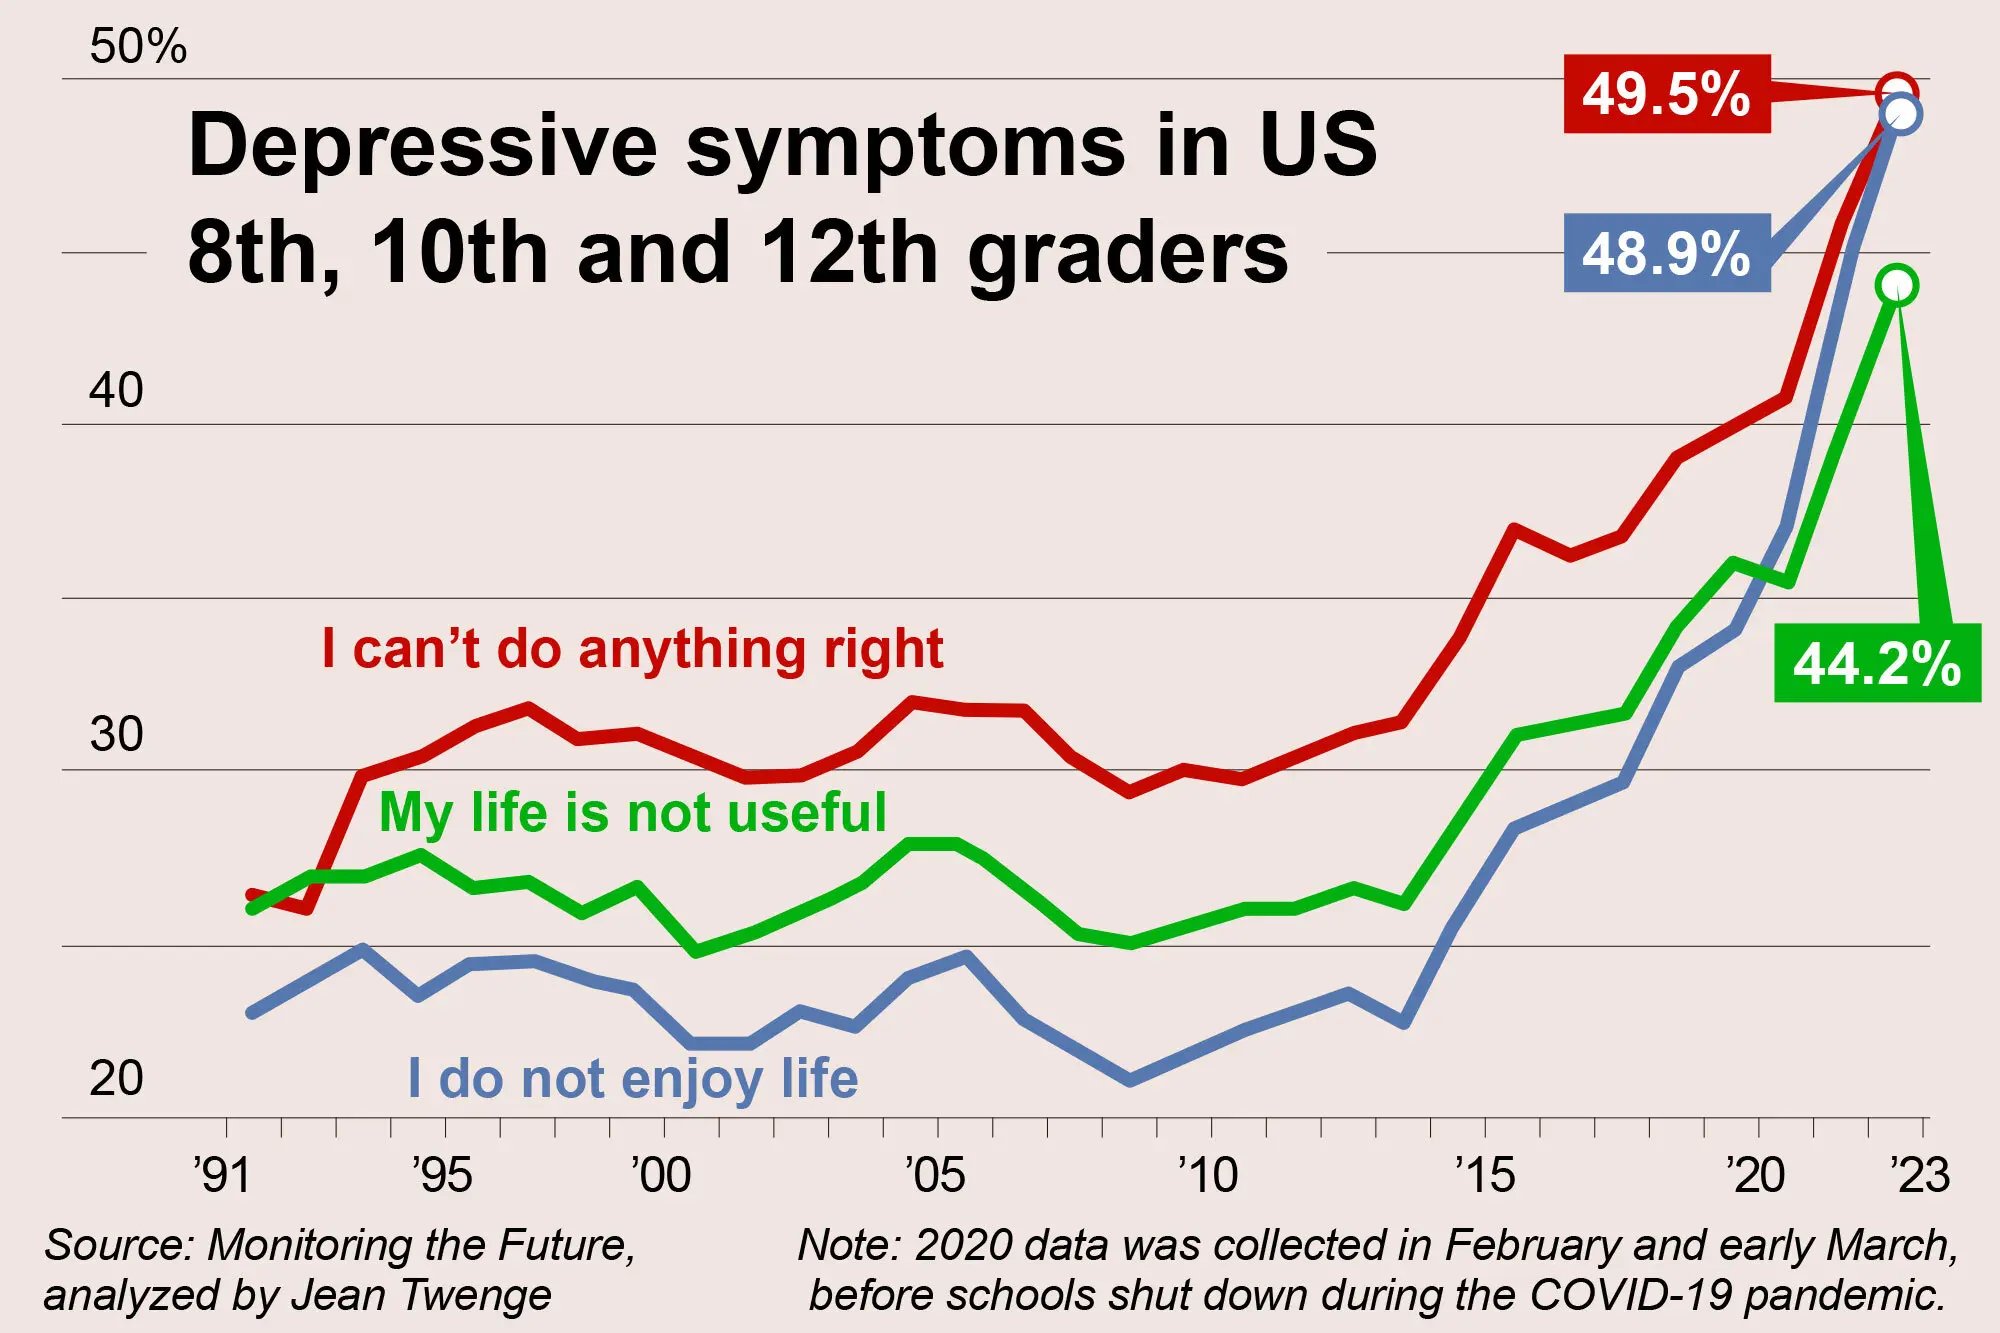
Notice how the right wing people saying the lockdowns caused this are wrong. The lockdowns certainly didn’t help, but this problem has been brewing for far longer.
Yeah, this is probably a chart showing social isolation and living online. Of course that would increase during lockdowns too, but the trend was already there.
Pretty sure you're just naming another symptom that is correlated but not the cause of the depression. Likely the cause of the depression and the isolation is the destruction of third places and the opportunity for unsupervised and unstructured play. Kids spend all their time online because there's nothing else for them to do. There's nowhere to play outside, and even if there is, they're not allowed to go there without adults micromanaging them.
Also I feel like external stressors are only magnifying as well
That, and the trend is continuing well into 2023, when the bulk of the lockdowns had ended.