-24
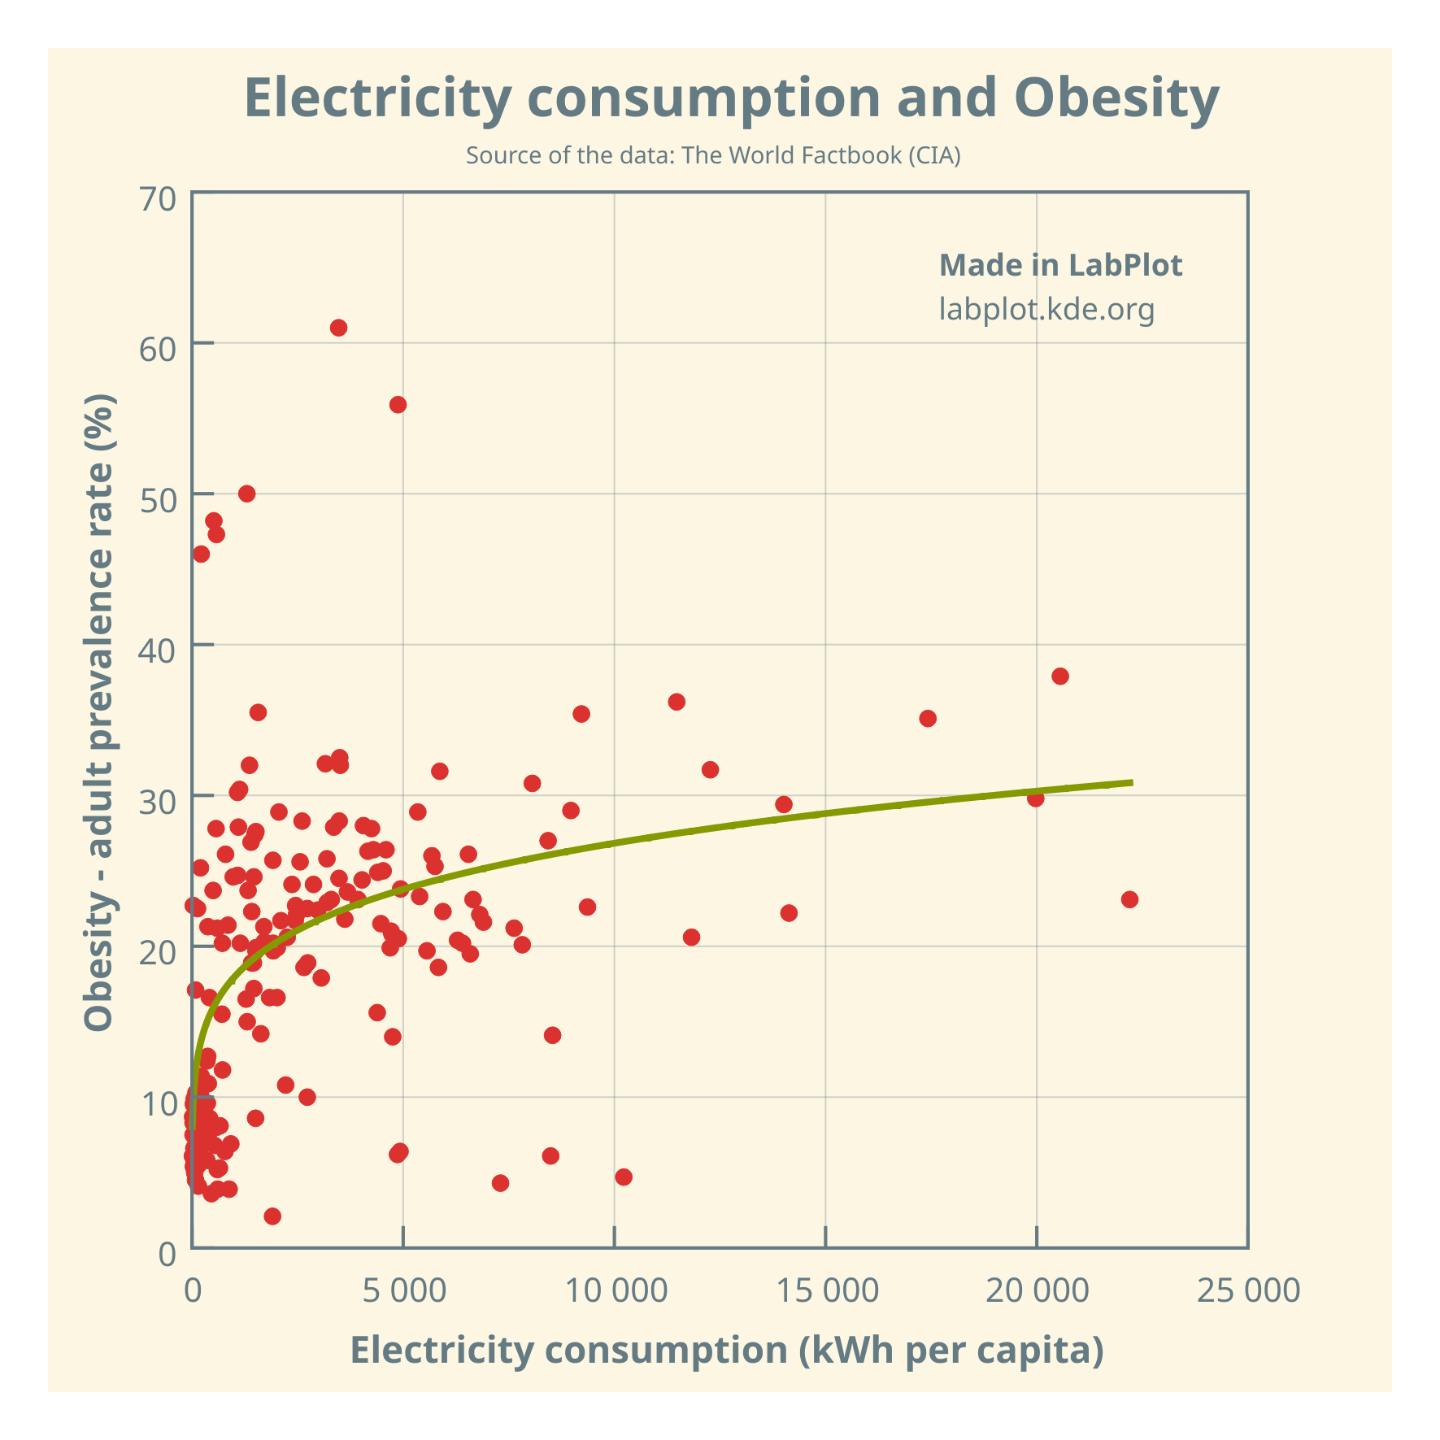
Is there a causal relationship between electricity consumption and obesity, or is it just an illusory correlation❓
(cdn.masto.host)
Is there a causal relationship between electricity consumption and obesity, or is it just an illusory correlation❓
@science @dataisbeautiful @health
The plot and curve fitting made in @LabPlot, a FREE, open source Data Visualization and Analysis software. It works on #Windows, #Linux and #macOS.
➡️ https://labplot.kde.org/download
#Data compiled for 184 countries.
#FOSS #FLOSS #OpenSource #FreeSoftware #DataViz #Visualization #Obesity #Health #ClimateChange #ClimateCrisis #Climate #Food
@Hazdaz @science
Is the act of distinguishing a question from an answer as difficult as recognizing spurious correlations?
The question has been raised earlier by others,. See for example this paper from 2021 (Measuring the effect of energy consumption on the epidemic
of overweight in Latin America and Caribbean countries):
https://dialnet.unirioja.es/descarga/articulo/8100043.pdf
You've fitted a curve through a bunch of points and called it correlation. It is not.
If you want to do this properly, you've got a lot of reading to do.