this post was submitted on 05 Jul 2023
1734 points (99.9% liked)
Lemmy.World Announcements
30611 readers
2 users here now
This Community is intended for posts about the Lemmy.world server by the admins.
Follow us for server news 🐘
Outages 🔥
https://status.lemmy.world/
For support with issues at Lemmy.world, go to the Lemmy.world Support community.
Support e-mail
Any support requests are best sent to info@lemmy.world e-mail.
Report contact
- DM https://lemmy.world/u/lwreport
- Email report@lemmy.world (PGP Supported)
Donations 💗
If you would like to make a donation to support the cost of running this platform, please do so at the following donation URLs.
If you can, please use / switch to Ko-Fi, it has the lowest fees for us
Join the team
founded 2 years ago
MODERATORS
you are viewing a single comment's thread
view the rest of the comments
view the rest of the comments


How did you learn it?
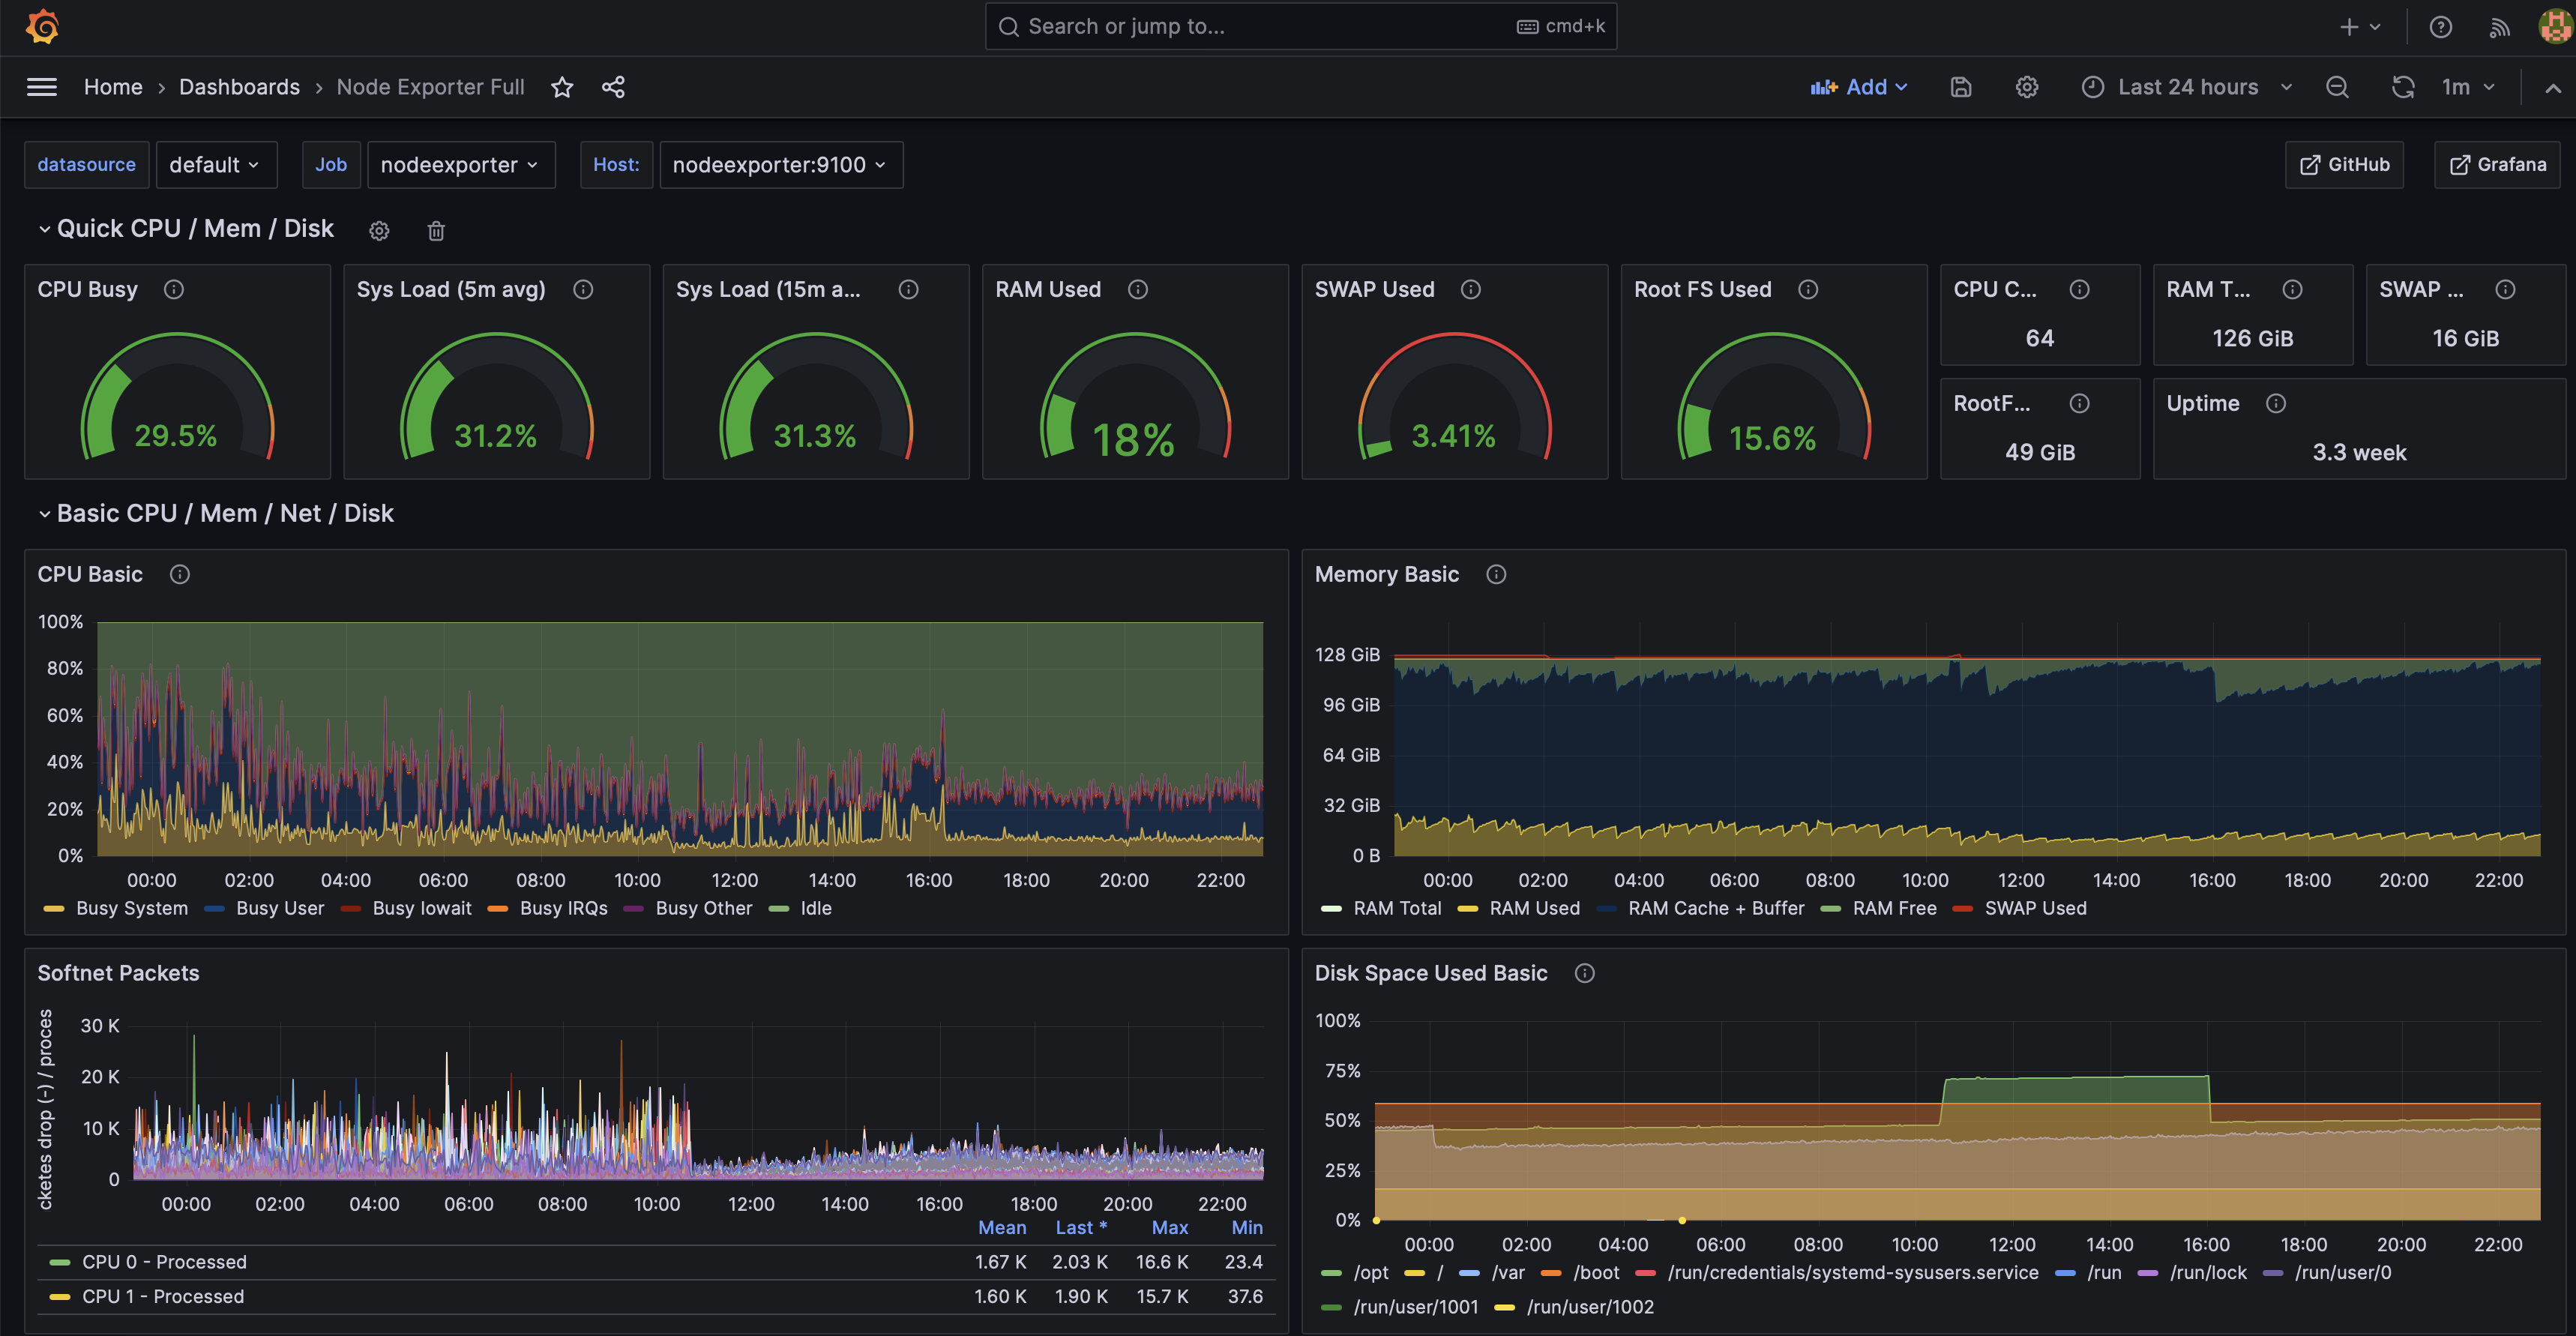
Basically brute force, I'm not great with it but I was the one on my team responsible for setting up our dashboards. I wrote the prometheus metric collection in our microservices and built the dashboards from that data.
There are tons of free dashboards though for monitoring resources and such so a lot of things I use are just downloaded from the Grafana website. And the docs are good too. So looking at examples + documentation is how I learn. It would be helpful if I was better with math though.
I guess it's time to start browsing the dashboards thanks