1
82
2
95
3
41

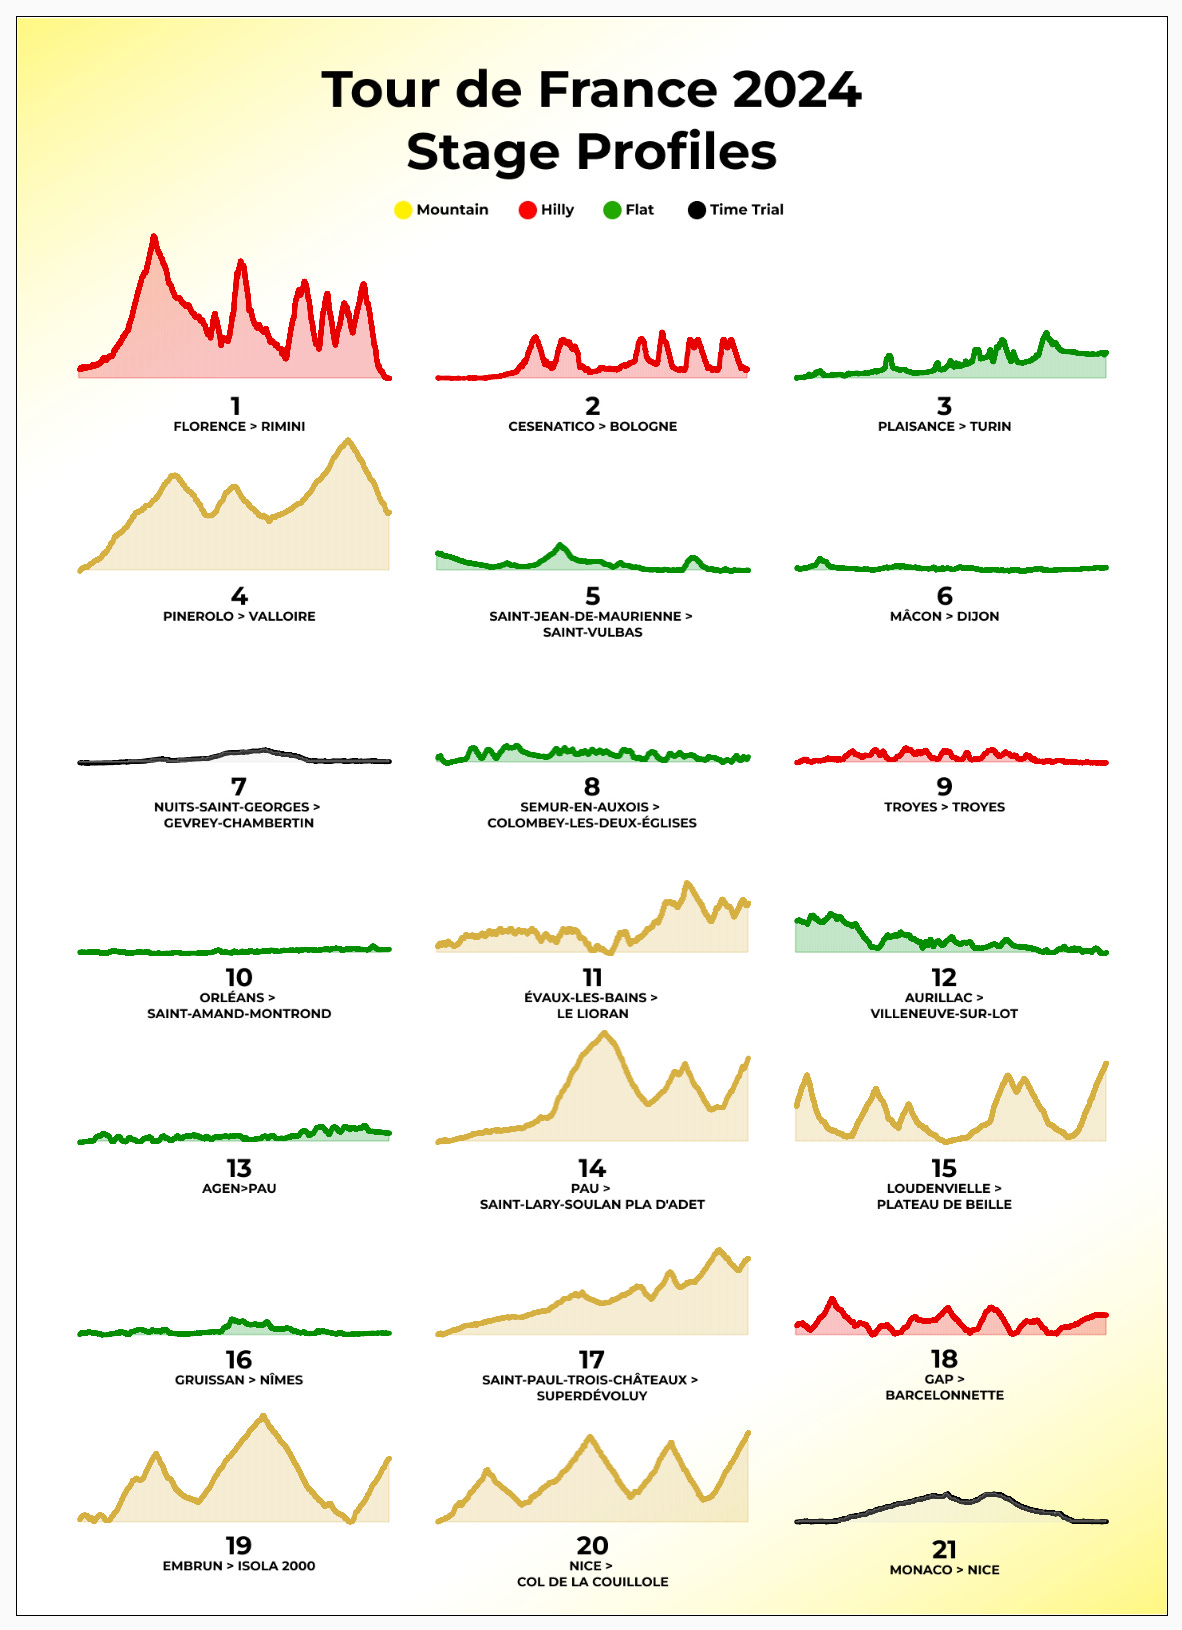
Source:https://stevenmarcscott.substack.com/p/tour-de-france-2024-stage-profiles?r=3qls9

4
15
5
22

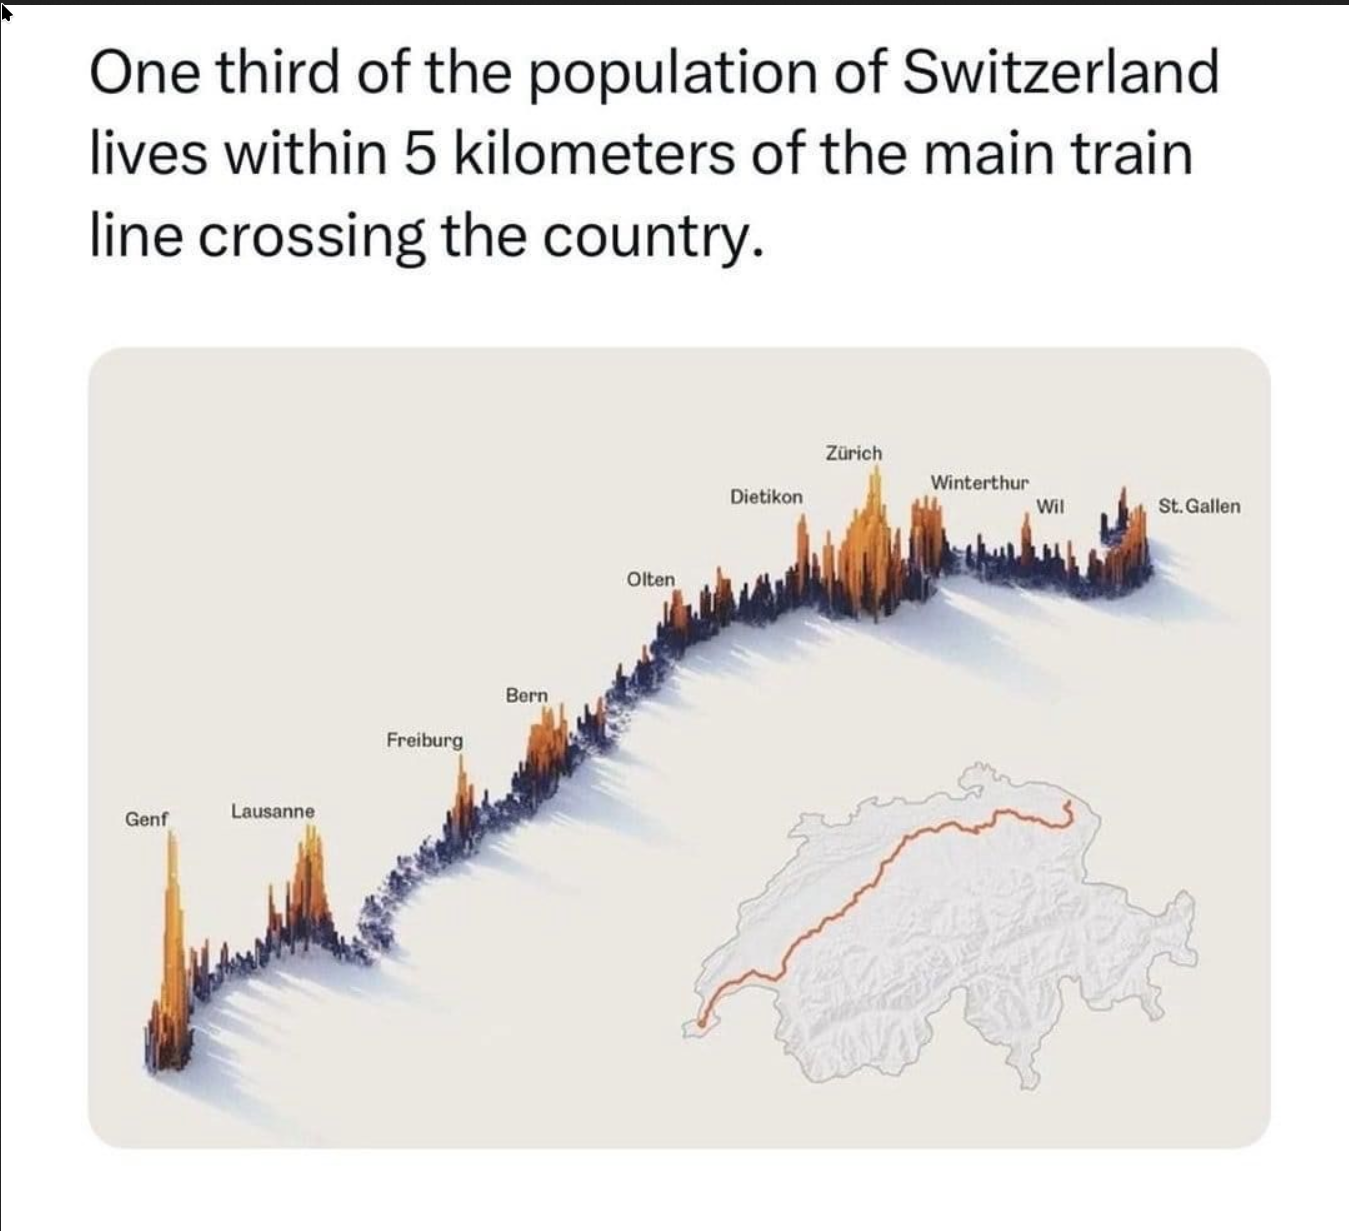
Basically, title.

6
268
7
89
submitted 5 days ago* (last edited 5 days ago) by Blaze@reddthat.com to c/dataisbeautiful@mander.xyz

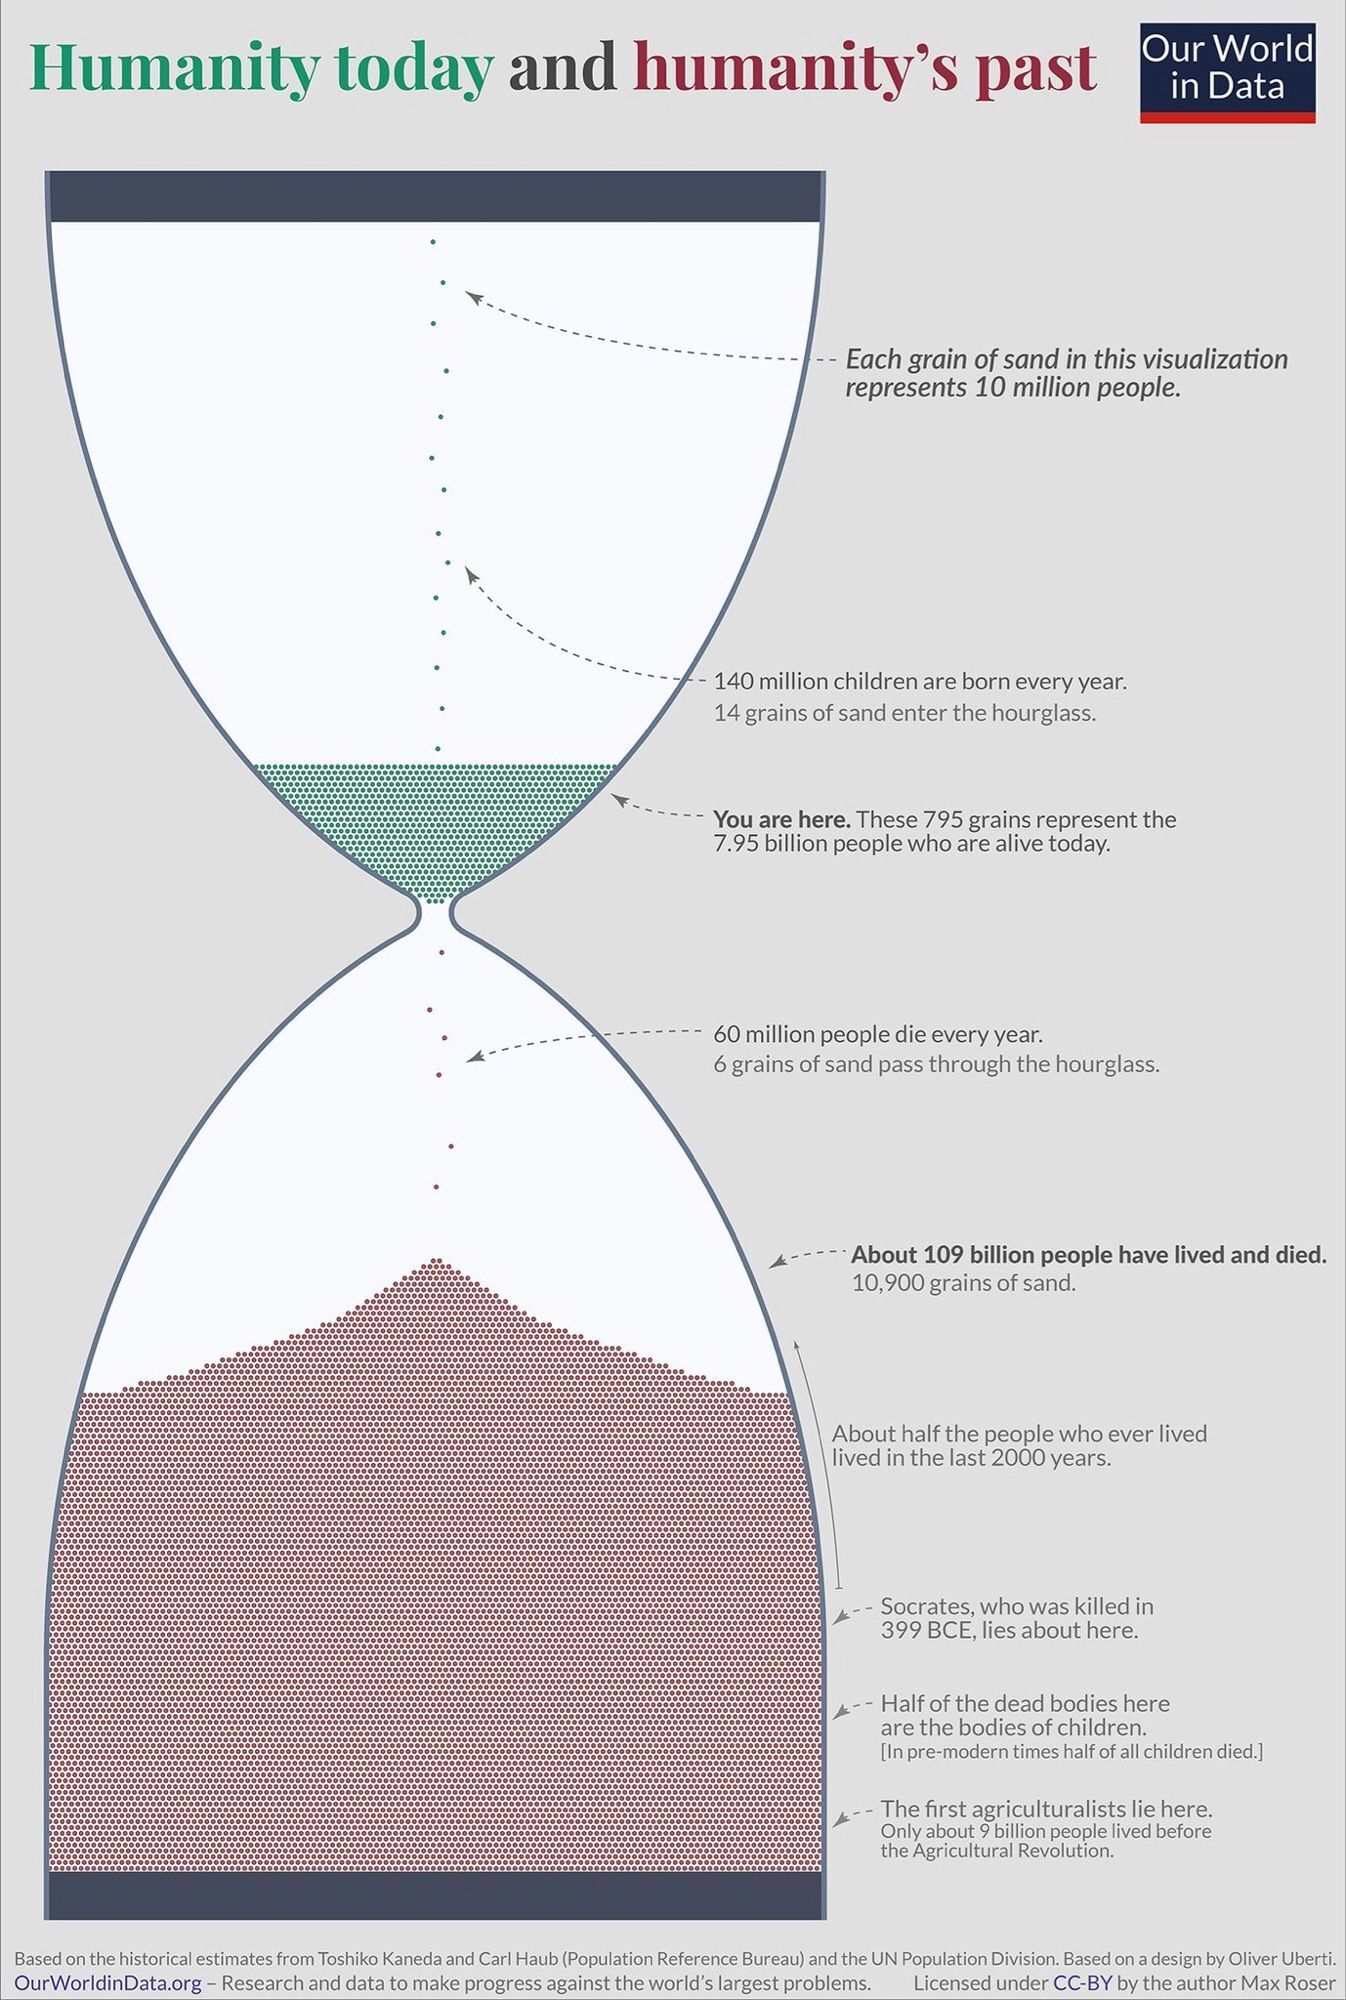
Source of data: https://dataverse.harvard.edu/dataset.xhtml?persistentId=doi:10.7910/DVN/T0HSJ1

Edit: removed OC as it's not (sorry)

8
18
9
190
10
60

Not the prettiest graph, but a neat way of putting all this information into one image.

Wiki Commons page: https://commons.m.wikimedia.org/wiki/File:Generation_timeline.svg#mw-jump-to-license

Wikipedia page on Generations: https://en.wikipedia.org/wiki/Generation

11
76

Source: https://www.douane.gouv.fr/la-douane/opendata/mots-cles/recolte

Be careful, numbers are department numbers, not quantity of wine (which is represented by the color)

12
65
13
60
Korn Track Length Analysis (files.catbox.moe)
14
11
15
18
submitted 5 days ago* (last edited 5 days ago) by SandbagTiara2816@lemmy.dbzer0.com to c/dataisbeautiful@mander.xyz
16
71

I sourced the data from dozens of 90s hip hop songs. Then used Python to analyze that file, and D3 to visualize the information. Here is a GitHub repo with the code I used. And here is a YouTube video exploring that code and how it all works together.

I'm not the original author. But I thought it was cool and thought it should live on Lemmy.

17
41
18
75
19
25
20
251
21
377
22
336
23
27
24
128
The Simpsons IMDB ratings (files.catbox.moe)
25
174
view more: next ›

Data is Beautiful

475 readers
158 users here now

founded 1 week ago
MODERATORS