Lemmy Today

1,464 readers
90 users here now

Welcome to lemmy.today!

About us

๐Ÿค— Thanks for joining our little instance here, located in Oregon. The idea is to have a fast, stable instance and allow users to subscribe to whatever content they want from here.

๐Ÿ˜Ž We dont block any other instances. We will keep it that way unless it becomes a moderation problem.

๐Ÿค  We will be around for a very long time, so you dont have to worry about us shutting down the instance anytime soon. We like performance and stability in our servers, and will upgrade the instance when its needed.

๐Ÿฅน Make sure to join a lot of remote communities to get a good feed going. How to do that is explained here.

Lemmy mobile apps

You should start using one of these ASAP since the web browser user interface is quite ugly, even with themes.

Optional Lemmy web browser user interfaces

Rules

Contact the admin

founded 1 year ago
ADMINS
1


cross-posted from: https://programming.dev/post/6660679

It's about asking, "how does this algorithm behave when the number of elements is significantly large compared to when the number of elements is orders of magnitude larger?"

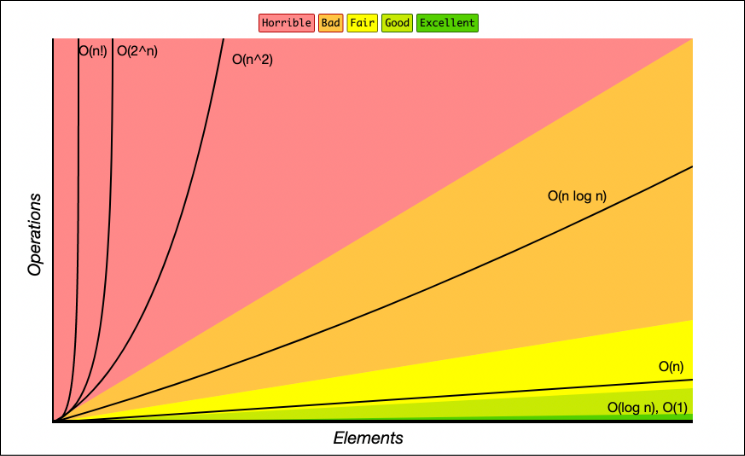
Big O notation is useless for smaller sets of data. Sometimes it's worse than useless, it's misguiding. This is because Big O is only an estimate of asymptotic behavior. An algorithm that is O(n^2) can be faster than one that's O(n log n) for smaller sets of data (which contradicts the table below) if the O(n log n) algorithm has significant computational overhead and doesn't start behaving as estimated by its Big O classification until after that overhead is consumed.

#computerscience

Image Alt Text:

"A graph of Big O notation time complexity functions with Number of Elements on the x-axis and Operations(Time) on the y-axis.

Lines on the graph represent Big O functions which are are overplayed onto color coded regions where colors represent quality from Excellent to Horrible

Functions on the graph:
O(1): constant - Excellent/Best - Green
O(log n): logarithmic - Good/Excellent - Green
O(n): linear time - Fair - Yellow
O(n * log n): log linear - Bad - Orange
O(n^2): quadratic - Horrible - Red
O(n^3): cubic - Horrible (Not shown)
O(2^n): exponential - Horrible - Red
O(n!): factorial - Horrible/Worst - Red"

Source

2


It's about asking, "how does this algorithm behave when the number of elements is significantly large compared to when the number of elements is orders of magnitude larger?"

Big O notation is useless for smaller sets of data. Sometimes it's worse than useless, it's misguiding. This is because Big O is only an estimate of asymptotic behavior. An algorithm that is O(n^2) can be faster than one that's O(n log n) for smaller sets of data (which contradicts the table below) if the O(n log n) algorithm has significant computational overhead and doesn't start behaving as estimated by its Big O classification until after that overhead is consumed.

#computerscience

Image Alt Text:

"A graph of Big O notation time complexity functions with Number of Elements on the x-axis and Operations(Time) on the y-axis.

Lines on the graph represent Big O functions which are are overplayed onto color coded regions where colors represent quality from Excellent to Horrible

Functions on the graph:
O(1): constant - Excellent/Best - Green
O(log n): logarithmic - Good/Excellent - Green
O(n): linear time - Fair - Yellow
O(n * log n): log linear - Bad - Orange
O(n^2): quadratic - Horrible - Red
O(n^3): cubic - Horrible (Not shown)
O(2^n): exponential - Horrible - Red
O(n!): factorial - Horrible/Worst - Red"

Source

view more: next โ€บ